Writing Technical Papers (in LaTeX)
This section draws heavily from work at my Alma Mater (UNL - specifically Dr. Godddard's Writing Resources site)
Standard Technical Paper Templates
The standard outline presented here, in different forms, is a tool to assist you in writing technical papers (especially in computer science). It is relevant for a wide range of, but not every, type of technical paper. It is certainly appropriate for Master's and Ph.D. theses, for conference and journal papers, and for technical reports. It is also appropriate for proposals, although the speculative nature of a project or thesis proposal requires some adaptation of the form. It is less appropriate for user documentation, but still explicitly represents a number of important issues that must be handled when writing product manuals. These outlines were first created by Douglas Niehaus, then modified by Steve Goddard and finally reproduced and edited here by Scot Anderson.
Under no circumstances shall you turn in a paper that contains any content from the template. This includes bold questions within the paragraphs (this does not apply to section names). Any repreductions of content constitutes plagerism and carries standard consequences from the syllabus.
LaTeX template:
My own grading rubric for project papers (No longer used, but still a good guideline) See: LaTeX Paper Dr. A Supplementary Rubric.doc
This simple LatexTemplate, with no content, works specifically with Winedt's gather function.
Grading Notation
   1 %Note the following two packages were added by Dr. A during Grading.
   2 %Edits are a combination of strikeout text (deleted) and red (added text)
   3 \usepackage{xcolor}
   4 \usepackage{ulem}
   5
   6 Strikeout text example: \sout{text to strike out} from the ulem package.
   7 Colored text: \textcolor{red}{Text colored red}.
LaTeX Tools
Writing Rules
Technical writing for sciences varies significantly from what you typically produce in English classes. When you write a technical report for Dr. Anderson, you must use the LaTeX template above and assiduously follow DrAndersonsRulesForWritingPapers.
Reviewing Technical Papers
Many students do not know how to review a technical paper. It is important to learn for (at least) two reasons. First, you may be asked to review a conference or journal paper. Second, you should always know your audience. Knowing what reviewers are looking for makes it easier to write a paper that they will understand (and like).
Prof. John Ousterhout (Berkeley) has a writeup on reviewing papers (available through Prof. Fox's page).
Using LaTeX Tips and Tricks
Include Inkscape drawings in LaTeX is a how-to for Inkscape - a great option.
If you are using eps files instead of .png/.jpg files (rare now), you may want to use wmf2eps to convert files to eps format. This is especially useful if you are using \psfrag to alter picture text. One issue to keep in mind when using \psfrag: always make sure your excel, visio, ... files use ONE letter substitutions. If you use more than one letter, MS products put them in as individual letters instead of strings (which is what psfrag is looking for).
We provide the following example constructs for LaTeX
Algorithm Template and Guidelines
Algorithms can be completed in two ways. The newest way is to use the listings package. It is an easy way to format real, working, code, provided you use some predefined formatting style. The benefit is that you use a real language, and it looks like it should! The second way is easy for very small pseudocode examples and uses the tabbing environment. Since there are no rules for pseudo-code in particular, I've provided some conventions on how to write it. The tabbing environment has more uses than just pseudo code, so you should be familiar with how it works.
Using Listings for Code
Here is an example using listings for C# code. Not the extra space in the closing three }} } can be omitted.
   1 \usepackage{listings}
   2 \usepackage{etoolbox}
   3 \usepackage{color}
   4 ...
   5
   6 \definecolor{base0}{RGB}{131,148,150}
   7 \definecolor{base01}{RGB}{88,110,117}
   8 \definecolor{base2}{RGB}{238,232,213}
   9 \definecolor{sgreen}{RGB}{133,153,0}
  10 \definecolor{sblue}{RGB}{38,138,210}
  11 \definecolor{scyan}{RGB}{42,161,151}
  12 \definecolor{smagenta}{RGB}{211,54,130}
  13
  14
  15 \newcommand\digitstyle{\color{smagenta}}
  16 \newcommand\symbolstyle{\color{base01}}
  17 \makeatletter %Allows the use of ampersand in a macro name giving access to lst@mod from package
  18 \newcommand{\ProcessDigit}[1]
  19 {%
  20   \ifnum\lst@mode=\lst@Pmode\relax%
  21    {\digitstyle #1}%
  22   \else
  23     #1%
  24   \fi
  25 }
  26 \makeatother %Returns ampersand to cat11 see: https://tex.stackexchange.com/questions/8351/what-do-makeatletter-and-makeatother-do
  27
  28 \lstdefinestyle{solarizedcsharp} {
  29   language=[Sharp]C,
  30   frame=lr,
  31   linewidth=160mm,
  32   breaklines=true,
  33   tabsize=2,
  34   numbers=left,
  35   numbersep=5pt,
  36   firstnumber=auto,
  37   numberstyle=\tiny\ttfamily\color{base0},
  38   rulecolor=\color{base2},
  39   basicstyle=\footnotesize\ttfamily,
  40   commentstyle=\color{base01},
  41   morecomment=[s][\color{base01}]{/*+}{*/},
  42   morecomment=[s][\color{base01}]{/*-}{*/},
  43   morekeywords={  abstract, event, new, struct,
  44                 as, explicit, null, switch,
  45                 base, extern, object, this,
  46                 bool, false, operator, throw,
  47                 break, finally, out, true,
  48                 byte, fixed, override, try,
  49                 case, float, params, typeof,
  50                 catch, for, private, uint,
  51                 char, foreach, protected, ulong,
  52                 checked, goto, public, unchecked,
  53                 class, if, readonly, unsafe,
  54                 const, implicit, ref, ushort,
  55                 continue, in, return, using,
  56                 decimal, int, sbyte, virtual,
  57                 default, interface, sealed, volatile,
  58                 delegate, internal, short, void,
  59                 do, is, sizeof, while,
  60                 double, lock, stackalloc,
  61                 else, long, static,
  62                 enum, namespace, string, var},
  63   keywordstyle=\bfseries\color{sgreen},
  64   showstringspaces=false,
  65   stringstyle=\color{scyan},
  66   identifierstyle=\color{sblue},
  67   extendedchars=true,
  68   captionpos=b,
  69   linewidth=0.99\textwidth,
  70   xleftmargin=.1\textwidth,
  71   literate=
  72     {0}{{\ProcessDigit{0}} }1
  73     {1}{{\ProcessDigit{1}} }1
  74     {2}{{\ProcessDigit{2}} }1
  75     {3}{{\ProcessDigit{3}} }1
  76     {4}{{\ProcessDigit{4}} }1
  77     {5}{{\ProcessDigit{5}} }1
  78     {6}{{\ProcessDigit{6}} }1
  79     {7}{{\ProcessDigit{7}} }1
  80     {8}{{\ProcessDigit{8}} }1
  81     {9}{{\ProcessDigit{9}} }1
  82     {\}}{{\symbolstyle{\}} } }1
  83     {\{}{{\symbolstyle{\{}} }1
  84     {(}{{\symbolstyle{(}} }1
  85     {)}{{\symbolstyle{)}} }1
  86     {=}{{\symbolstyle{$=$}} }1
  87     {;}{{\symbolstyle{$;$}} }1
  88     {>}{{\symbolstyle{$>$}} }1
  89     {<}{{\symbolstyle{$<$}} }1
  90     {\%}{{\symbolstyle{$\%$}} }1,
  91 }
  92
  93 \lstset{escapechar=@,style=solarizedcsharp}
  94
  95 ...
  96
  97 \begin{lstlisting}[label={lst:EuclidAlg},caption={Euclid's algorithm.}]
  98 EUCLID(a,b) {
  99     A = a
 100     B = b
 101     while (true) {
 102         if (B=0) return A
 103         R= A \% B
 104         A = B$
 105         B = R$
 106     }
 107 }
 108 \end{lstlisting}
The above code results in the not so correct C# code:

Formatting with Tabbing
This method is not exclusive to formatting code. It works like old typewriters did and, in fact, makes LaTeX act like a typewriter.
The following symbols are used in the tabbing environment:
- \= sets a tab
\> uses it
- \\ ends a line (every line!)
   1 \noindent
   2 \begin{minipage}{4.4in}
   3 \tt
   4 \noindent
   5 \hrulefill
   6 \begin{tabbing}
   7 {\bf  Sat(M,n)} \\
   8 {\bf input:} Matrix $M$ representing a gap-graph over $n+1$ vertices.\\
   9 {\bf output:} True or False depending on whether $M$ is satisfiable. \\
  10 \\ m := 0 \\
  11 {\bf repeat} \= \\
  12           \> m := m + 1 \\
  13           \> {\bf for} \= i := 0 to n {\bf do} \\
  14           \>           \> {\bf for} \= j := 0 to n {\bf do} \\
  15           \>           \>           \> {\bf for} \= k := 0 to n {\bf do} \\
  16           \>           \>           \>           \> $M[i,j] := \max(M[i,j],M[i,k]+M[k,j])$ \\
  17           \>           \>           \> {\bf end-for} \\
  18           \>           \> {\bf end-for} \\
  19           \> {\bf end-for} \\
  20 {\bf until}  $m = \log(n+1)$ \\
  21 \\
  22 Flag := True \\
  23 \\
  24 {\bf for} \= i := 0 to n {\bf do} \\
  25           \> {\bf if} \= $M[i,i] > 0$ {\bf then} \\
  26           \>          \> Flag := False \\
  27 {\bf end-for} \\
  28 \\
  29 {\bf return}(Flag)
  30 \end{tabbing}
  31 \hrulefill\\
  32 \rm
  33 \end{minipage}
In pseudo code, make sure you:
- specify the input and output parameters
- declare and initialize all the variables used.
- do not declare or initialize variables you do *not* use.
When typesetting, write the name of:
- functions and procedures in small caps font {\sc Function-Name}
- data structures in emphasized font {\em data-structure-name}
- constants in courier font {\tt Constant-Name}
- For making an assignment, use the form $$a \leftarrow b$$
- For making a test, use the form $$a = b$$
- For control constructs, limit yourself to the minimum: while, repeat, for, etc.. Do not use when, unless (they are Lisp'y and not conventional).
- Use an algorithm style package, avoid formatting yourself.
- Make sure you provide a worst-case complexity estimate in the text.
LaTeX Definitions I frequently Use
I usually place the text below before the \begin{document} element which allows me to use \progstart and \progend around a tabbing environment:
   1 %defines the datalog operator :- with correct spacing etc.
   2 \def\lfp{\mathop{\hbox{\it lfp}} }
   3 \def\impl{\mathrel{\hbox{~~:---~~}} }
   4
   5 %defines the program code minipage environment that I used with rules top and bottom
   6 %NOTE: you will need to change the lift value for the \rule command. This is set for 1.5 spacing.
   7 %      single spacing: 6pt/6pt and doublespacing: 0pt and 12 point (I believe)
   8 %NOTE: If you use a \tabbing environment immediately after \progstart, (follow progstart by) put \vspace{-18pt}
   9 \def\progstart{\begin{center}\begin{minipage}{0.98\textwidth}\tt\small\noindent\rule[0pt]{\textwidth}{0.4pt} \\}
  10 \def\progend{\rm\rule[6pt]{\textwidth}{0.4pt} \\ \end{minipage}\end{center}}
Relational Algebra symbols
   1 \def\ojoin{\setbox0=\hbox{$\bowtie$}%
   2   \rule[-.02ex]{.25em}{.4pt}\llap{\rule[\ht0]{.25em}{.4pt}} }
   3 \def\leftouterjoin{\mathbin{\ojoin\mkern-5.8mu\bowtie}}
   4 \def\rightouterjoin{\mathbin{\bowtie\mkern-5.8mu\ojoin}}
   5 \def\fullouterjoin{\mathbin{\ojoin\mkern-5.8mu\bowtie\mkern-5.8mu\ojoin}}
   6
   7 \begin{document}
   8 \[A\leftouterjoin B\]
   9 \[A\rightouterjoin B\]
  10 \[A\fullouterjoin B\]
  11 \end{document}
HOW TO FORMAT CHARTS
- The labels of the axes of a chart should be centered (vertically and horizontally) and in bold face.
- Do not use different colors to draw data in charts, but use different line/rectangle patterns. Make sure they print well on black and grey and are clearly distinguishable.
- Make sure lines are thick enough and do not fade too easily with repeated photocopying of the document.
HOW TO INCLUDE FIGURES
Use the following figure template for one figure:
Use the following template for two or more figures WITH DIFFERENT CAPTIONS:
   1   \begin{figure}[ht]
   2   \begin{minipage}[t]{.45\textwidth}
   3   \centerline{\psfig{file=<file-directory/file-name>.eps,height=xcm}}
   4   \caption{\small Some text.}
   5   \label{fig:xx}
   6   \end{minipage}
   7   \hfil
   8   \begin{minipage}[t]{.45\textwidth}
   9   \centerline{\psfig{file=<file-directory/file-name>.eps,height=xcm}}
  10   \caption{\small Some text.}
  11   \label{fig:xx}
  12   \end{minipage}
  13   \end{figure}
Use the following template for two or more figures WITH THE SAME CAPTION:
   1   \begin{figure}[ht]
   2   \begin{center}
   3   \begin{tabular}{ccc}
   4   \psfig{file=<file-directory/file1>.eps,height=5cm} &
   5   \psfig{file=<file-directory/file2>.eps,height=5cm} &
   6   \psfig{file=<file-directory/file3>.eps,height=5cm} &
   7   \end{tabular}
   8   \end{center}
   9   \caption{\small Left: xxx. Center: xxx. Right: xxx.}
  10   \label{fig:xx}
  11   \end{figure}
HOW TO INCLUDE TABLES
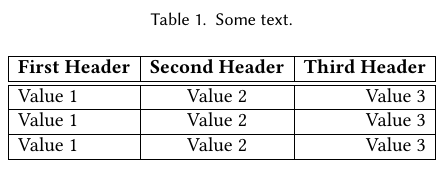
Use the following figure template for one table:
   1   \begin{table}[ht]
   2         %\begin{center} %Optionally you can center your table - depending on the format required
   3         \caption{\small Some text.}
   4         \label{tab:xx}
   5
   6         \begin{tabular}{|l|c|r|}
   7                 \hline
   8                 \textbf{First Header} & \textbf{Second Header} & \textbf{Third Header} \\
   9                 \hline \hline
  10                 Value 1 & Value 2 & Value 3 \\ \hline
  11                 Value 1 & Value 2 & Value 3 \\ \hline
  12                 Value 1 & Value 2 & Value 3 \\ \hline
  13         \end{tabular}
  14         %\end{center} %Of course don't forget to end center if required.
  15 \end{table}
Will look like this:

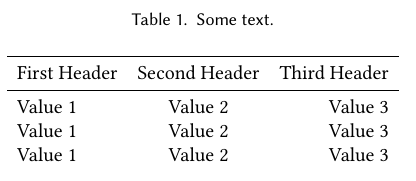
However, be aware that different formats such as ACM may require you to create your table with specific elements like \toprule and \midrule lines. Which would then look like this:

Using LaTeX on this site
There are two ways to use LaTeX. Inline: $$\LaTeX$$
And centerd $$$E=mc^2$$$
With MathJax you can no longer include an entire paragraph of straight $$\LaTeX$$.
